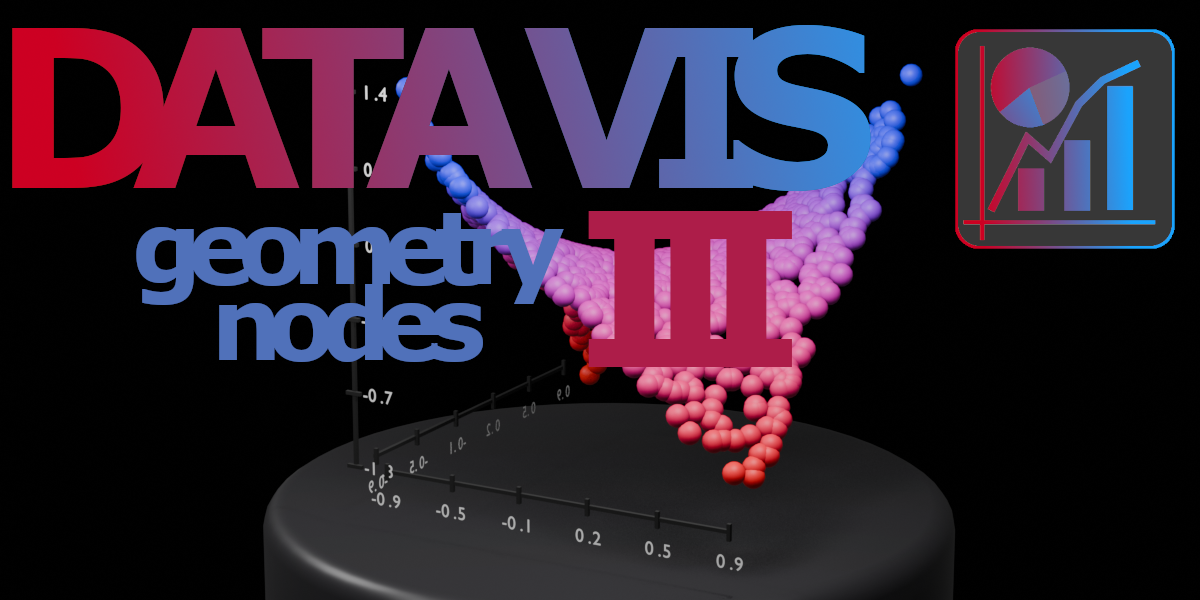
Data visualisation addon brings charts into Blender. You can load your data and visualise it using tools addon provides. Make the visualisations suit your needs by using various customization, animation or colour options.
Every kind of array as one mechanism: 11 distributions, live handles, a pie and a viewport card. Paint copies, mask them, stack arrays of arrays, and finish as instances, objects, one mesh, holes or keys.